Tableau vs Power BI: Feature Comparison Table
| Parameter | Tableau | Power BI | Example Use Case |
|---|---|---|---|
| Ease of Use | Requires moderate learning but offers intuitive drag-and-drop functionality for data analysis. | Simple and user-friendly, especially for users familiar with Excel. | A beginner using Power BI for quick sales analysis. |
| Pricing | Premium pricing with distinct plans for Tableau Desktop, Server, and Online. | Affordable, with free and Pro versions; Enterprise options available at competitive rates. | A startup leveraging Power BI’s free version for basic reporting. |
| Data Connectivity | Connects to over 80 data sources, including Salesforce, Hadoop, and AWS. | Strong integration with Microsoft tools like Azure, Excel, and SharePoint, plus third-party sources. | A retail company syncing Tableau with Salesforce CRM for customer insights. |
| Performance | Handles large datasets efficiently, optimized for high-scale visualizations. | Works well with moderate datasets; performance can lag with very large datasets. | An e-commerce company analyzing global sales trends with Tableau. |
| Visualization Options | Extensive library of charts with advanced customization and interactivity. | Wide range of visuals, but less customizable compared to Tableau. | A financial analyst creating custom heat maps in Tableau. |
| Real-Time Analytics | Offers robust real-time analytics with live data connections. | Supports real-time dashboards with Azure Stream Analytics. | A logistics firm monitoring fleet performance in real time with Tableau. |
| Collaboration Features | Allows secure sharing via Tableau Server or Tableau Online. | Collaborative features through Microsoft Teams and SharePoint integration. | A remote team collaborating on sales dashboards in Power BI. |
| Artificial Intelligence | AI-driven features like Explain Data and Ask Data for advanced insights. | Integrated with Microsoft AI tools like Cortana and Azure Machine Learning. | A data scientist using Power BI with Azure AI for predictive maintenance in manufacturing. |
| Integration | Works seamlessly with third-party tools and platforms. | Best for organizations using the Microsoft ecosystem. | An IT firm integrating Power BI with Azure for centralized reporting. |
| Community Support | Strong global community with regular updates and robust user forums. | Backed by Microsoft’s ecosystem and a growing user base. | A Tableau user finding solutions through Tableau Community forums. |
| Mobile Access | Fully responsive mobile app with interactive dashboards. | Mobile app available but less flexible compared to Tableau. | A sales manager accessing Tableau dashboards on the go. |
| Advanced Analytics | Superior analytics capabilities with built-in statistical tools and R/Python integration. | Good for business analytics; advanced users need to learn DAX for complex calculations. | A data analyst leveraging Tableau’s R integration for predictive analysis. |
| Deployment Options | Flexible: on-premise, cloud, and hybrid solutions available. | Primarily cloud-based but supports on-premise with Power BI Report Server. | A large enterprise opting for Tableau’s hybrid deployment for data compliance. |
| User Base | Preferred by data analysts and statisticians for complex analysis. | Popular among business professionals for its ease of use and affordability. | An accountant using Power BI for quick monthly financial reporting. |
| Free Trial | Offers a 14-day free trial for Tableau Desktop. | Free tier with basic features; Pro version offers a 60-day free trial. | A freelancer testing Tableau’s trial for client projects. |
Detailed Analysis with Examples
1. Ease of Use
Tableau: Though Tableau’s drag-and-drop interface is intuitive, new users may find its advanced features challenging. However, once mastered, it provides unparalleled depth for creating detailed visualizations.
Example: A data scientist exploring Tableau’s features to create a Sankey chart for visualizing customer journey patterns.
Power BI: Designed for business users, Power BI’s interface is straightforward, especially for those familiar with Microsoft tools like Excel.
Example: A small business owner using Power BI to track inventory trends.
2. Pricing
Tableau: Tableau is priced for enterprises, with separate licensing fees for different components.
Example: A Fortune 500 company invests in Tableau Server for organization-wide analytics.
Power BI: Power BI’s free version attracts small businesses, while Pro and Premium versions cater to larger organizations.
Example: A startup opting for Power BI’s Pro version for collaborative reporting.
3. Data Connectivity
Tableau: Connects to over 80 data sources, making it ideal for organizations with diverse data environments.
Example: Integrating Tableau with Snowflake to visualize real-time warehouse data.
Power BI: Offers deep integration with Microsoft services, such as Azure and SharePoint.
Example: A marketing team using Power BI to combine SharePoint lists and social media data.
4. Performance
Tableau: Known for high-speed processing of large datasets, even in complex scenarios.
Example: A retail chain analyzing millions of daily transactions with Tableau.
Power BI: Performance is optimal for medium-sized datasets but may lag with extremely large datasets.
Example: A mid-sized firm analyzing departmental KPIs in Power BI.
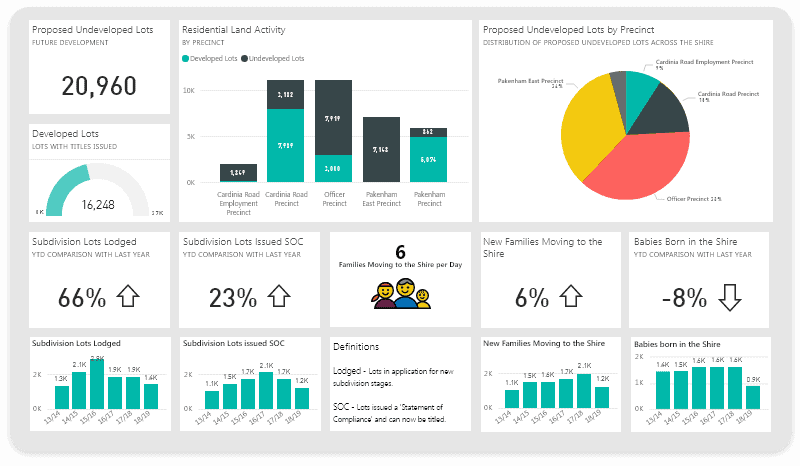
Visualization: Real-World Applications
- Tableau: Creating geo-spatial maps for logistics companies.
- Power BI: Generating automated reports for weekly team reviews.
Real-Time Analytics
Both tools excel in real-time analytics. For instance:
- Tableau: Monitoring customer interactions in real-time for a telecom provider.
- Power BI: Tracking stock prices for a financial advisory firm.
Advanced Analytics
Example:
- Tableau: Using Python integration to perform machine learning tasks for a health-tech company.
- Power BI: Leveraging DAX formulas to calculate profitability in an e-commerce business.
Conclusion: Which Tool Should You Choose?
Your decision between Tableau and Power BI should align with your organization’s needs, budget, and technical expertise:
- Choose Tableau for complex data analysis, advanced visualizations, and robust performance with large datasets.
- Opt for Power BI if you’re already invested in the Microsoft ecosystem or need an affordable, easy-to-use tool.
Both Tableau and Power BI are exceptional platforms with distinct strengths. By exploring their features in real-world scenarios, as illustrated in this post, you can confidently select the tool that aligns with your business goals.
Meta Description:
A detailed comparison of Tableau vs Power BI across 15 key parameters, including pricing, features, performance, and real-world examples. Learn which BI tool suits your needs best.
Keywords: Tableau vs Power BI, Business Intelligence tools comparison, Tableau pricing, Power BI features, Data visualization examples.


