Power BI and Tableau are both popular data visualization and business intelligence tools that are used to analyze and present data. Here is a comparison of the two:
- User interface: Tableau is known for its intuitive and user-friendly interface, while Power BI has a more straightforward interface that is designed for ease of use.
- Data Connectivity: Power BI has a wide range of data connectors, including cloud-based data sources, while Tableau supports a wider range of data types, including geospatial and time-series data.
- Data preparation: Tableau has a more sophisticated data preparation experience, with the ability to blend and clean data from multiple sources, while Power BI has a simpler data preparation process that relies on pre-built data connectors.
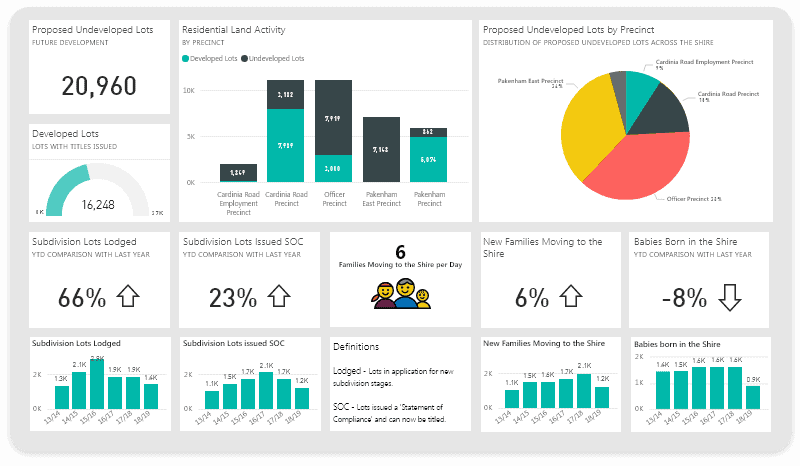
- Visualization capabilities: Tableau has a more extensive set of visualization options and a stronger focus on data storytelling, while Power BI has a more streamlined set of visualization options and a stronger focus on dashboards.
- Scalability: Tableau is a more scalable solution, with the ability to handle large amounts of data and users, while Power BI is designed for smaller to medium-sized organizations.
- Cost: Power BI is generally considered to be more cost-effective, with a lower upfront cost and a more flexible pricing model, while Tableau is generally considered to be more expensive, with a higher upfront cost and a more rigid pricing model.
The choice between Power BI and Tableau will depend on the specific needs of the organization and the use case. Both tools have their strengths and weaknesses, and organizations should carefully evaluate their requirements and capabilities before making a decision.


