How to Start a Career in Business Analytics in 2024: A Step-by-Step Guide for Freshers
As businesses across all industries increasingly rely on data-driven decisions, the demand for skilled business analysts has surged. If you’re considering a career in business analytics, you’re on the path to a rewarding field with opportunities to solve real-world problems using data insights. In this guide, we’ll walk through the step-by-step process to start a career in business analytics, the essential certifications, entry-level job options, and the best tools to learn along the way.
Step 1: Understand the Role of a Business Analyst
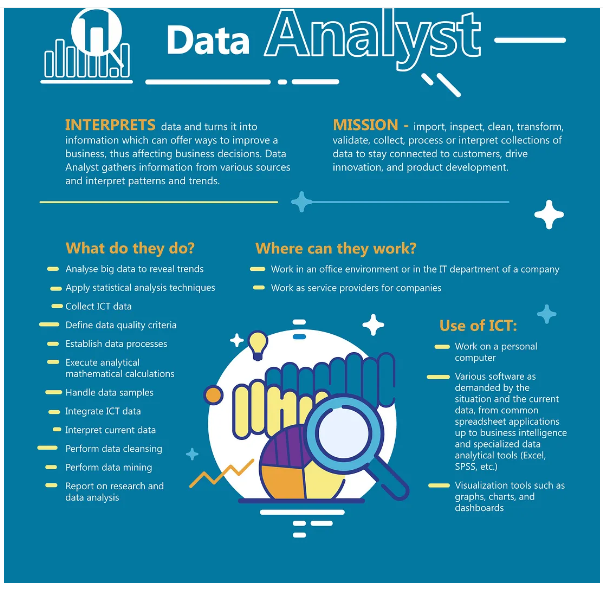
A business analyst (BA) uses data analytics to bridge the gap between business processes and technology. The primary role of a business analyst is to understand and translate data into actionable insights, helping organizations make data-informed decisions that improve productivity, efficiency, and profitability.
- Importance: BAs enable organizations to make strategic decisions, providing a significant advantage in today’s competitive landscape.
- Functions: Gathering requirements, analyzing data, generating insights, creating dashboards, and reporting.
Step 2: Develop Foundational Skills in Business Analytics
Before diving into technical tools and advanced certifications, it’s essential to build a strong foundation in basic analytical and statistical skills. Key areas to focus on include:
- Statistics and Probability: Understanding core statistical concepts is crucial for analyzing and interpreting data. Free resources like Khan Academy offer beginner courses in statistics.
- Excel: Excel remains a fundamental tool in business analytics, especially for data manipulation, visualization, and basic analytics functions. You can learn from tutorials on Microsoft’s website.
These skills will be the basis for more advanced tools and techniques.
Step 3: Learn Essential Business Analytics Tools
Familiarity with data analytics tools is a critical aspect of a career in business analytics. Here are some of the most commonly used tools:
- Microsoft Excel: Ideal for beginners, Excel offers data visualization and simple analytics capabilities.
- Link: Microsoft Excel
- SQL (Structured Query Language): SQL is essential for working with databases and retrieving data efficiently.
- Link: SQL Basics – W3Schools
- Tableau: Tableau is a data visualization tool widely used for creating interactive dashboards and data reports.
- Link: Tableau
- Power BI: Microsoft’s data visualization tool for transforming raw data into meaningful insights.
- Link: Power BI
- Python: Python is a powerful language for data analysis and visualization, with libraries like Pandas and Matplotlib.
Step 4: Get Certified in Business Analytics
Earning certifications in business analytics demonstrates your expertise to potential employers and can boost your career prospects. Here are a few certifications worth considering:
1. Microsoft Certified: Data Analyst Associate
- Importance: Validates skills in using Power BI for data analysis.
- Preparation Resources: Microsoft Certified: Data Analyst Associate
2. IBM Data Analyst Professional Certificate
- Importance: Covers fundamental data analysis skills, including Excel, SQL, Python, and data visualization.
- Preparation Resources: IBM Data Analyst on Coursera
3. Google Data Analytics Professional Certificate
- Importance: Teaches data analytics tools like SQL, R, and Tableau.
- Preparation Resources: Google Data Analytics Certificate on Coursera
4. Certified Business Analysis Professional (CBAP)
- Importance: Recognized by the International Institute of Business Analysis (IIBA), this certification focuses on business analysis skills and methodologies.
- Preparation Resources: CBAP Certification
Step 5: Gain Hands-On Experience with Projects
After building foundational skills and earning certifications, the next step is to gain hands-on experience. Working on projects will help you apply theoretical knowledge to real-world scenarios, build your portfolio, and prepare for job interviews.
- Sample Projects:
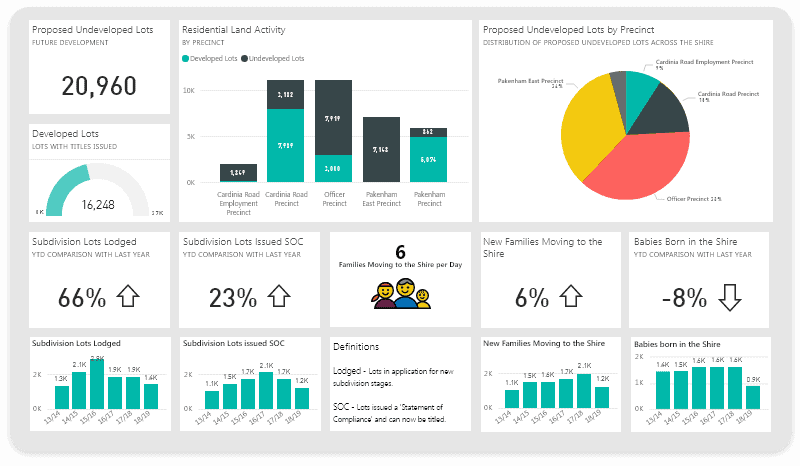
- Sales Performance Dashboard: Use tools like Power BI or Tableau to create a dashboard displaying key sales metrics.
- Customer Churn Analysis: Use Python or Excel to analyze customer data and identify factors contributing to churn.
- Market Basket Analysis: Implement a market basket analysis using Python’s
mlxtendlibrary to identify popular product combinations.
Step 6: Apply for Entry-Level Positions in Business Analytics
There are several entry-level roles suitable for freshers in business analytics. These roles require basic knowledge of data analysis, data visualization, and problem-solving skills.
- Junior Data Analyst
- Business Intelligence (BI) Analyst
- Role: Uses data visualization tools to create insights and dashboards for business teams.
- Skills: Knowledge of Power BI or Tableau, and basic SQL skills.
- Job Boards: Search for “Business Intelligence Analyst” on major job platforms.
- Data Visualization Specialist
Step 7: Network and Join Business Analytics Communities
Networking is essential for finding job opportunities and staying updated on industry trends. Joining business analytics communities can provide access to learning resources, job leads, and mentorship.
- LinkedIn: Follow business analytics groups and engage with professionals in the field.
- Kaggle: Kaggle is a data science community where you can participate in competitions, practice with datasets, and build your portfolio.
- Link: Kaggle
Step 8: Prepare for Business Analytics Job Interviews
For entry-level business analytics roles, interview questions will typically cover foundational concepts, basic tool knowledge, and practical problem-solving abilities. Here are some tips for interview preparation:
- Revise Core Concepts: Review statistics, SQL queries, and basic Excel functions.
- Practice SQL Queries: Be prepared to write SQL queries to retrieve and manipulate data.
- Data Storytelling: Employers value the ability to communicate insights effectively. Practice presenting a data project or dashboard and explaining its significance.
- Mock Interviews: Sites like Pramp offer free mock interviews to improve your confidence and communication skills.


